Discussion:
[Matplotlib-users] Two circles with “exponential decay” coloring, and alpha < 1, having trouble with color mixing?
Brian Merchant
2015-11-21 00:46:45 UTC
Permalink
Hi all,

In order to get circles such that their coloring is radially symmetric,
with center being the darkest, and exponential decay in color as one moves
farther away from the center along the radius, I used imshow with clip_path
using Circle patches.

Here's a toy script that overlaps two such circles:
https://gist.github.com/bmer/7063cc2dd09f1b80a252

As you can see if you run the script (or, if you follow this link:
Loading Image...), even though the alpha is set at 0.5, there
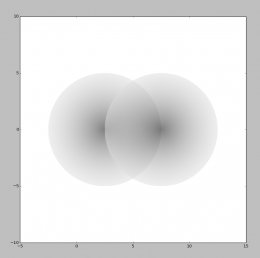
doesn't seem to be proper "color mixing" occurring (we should see a result
that is symmetric along the x-axis).

Why is that, and what could I do to fix this issue?

Kind regards,
Brian
Sterling Smith
2015-11-23 18:54:31 UTC
Permalink
Maybe the issue is with the colormap not having an alpha? Does this
http://stackoverflow.com/questions/10127284/overlay-imshow-plots-in-matplotlib
help?

Otherwise, you might file a bug at
https://github.com/matplotlib/matplotlib/issues/new

-Sterling
Post by Brian Merchant
Hi all,
In order to get circles such that their coloring is radially symmetric, with center being the darkest, and exponential decay in color as one moves farther away from the center along the radius, I used imshow with clip_path using Circle patches.
Here's a toy script that overlaps two such circles: https://gist.github.com/bmer/7063cc2dd09f1b80a252
As you can see if you run the script (or, if you follow this link: http://i.imgur.com/H9jEAZ3.png), even though the alpha is set at 0.5, there doesn't seem to be proper "color mixing" occurring (we should see a result that is symmetric along the x-axis).
Why is that, and what could I do to fix this issue?
Kind regards,
Brian
------------------------------------------------------------------------------
_______________________________________________
Matplotlib-users mailing list
https://lists.sourceforge.net/lists/listinfo/matplotlib-users
Thomas Caswell
2015-11-23 22:41:56 UTC
Permalink
The way we do the alpha blending, the output value is (alpha * v1) +
((alpha-1) * v2). All of the artists are compsited down on top of a white
background so the compositing is not commutative.

(a * .5) + (.5 * (b * .5 + .5)) =/= (b * .5) + (.5 * (a * .5 + .5))
Post by Sterling Smith
Maybe the issue is with the colormap not having an alpha? Does this
http://stackoverflow.com/questions/10127284/overlay-imshow-plots-in-matplotlib
help?
Otherwise, you might file a bug at
https://github.com/matplotlib/matplotlib/issues/new
-Sterling
Post by Brian Merchant
Hi all,
In order to get circles such that their coloring is radially symmetric,
with center being the darkest, and exponential decay in color as one moves
farther away from the center along the radius, I used imshow with clip_path
using Circle patches.
https://gist.github.com/bmer/7063cc2dd09f1b80a252
http://i.imgur.com/H9jEAZ3.png), even though the alpha is set at 0.5,
there doesn't seem to be proper "color mixing" occurring (we should see a
result that is symmetric along the x-axis).
Post by Brian Merchant
Why is that, and what could I do to fix this issue?
Kind regards,
Brian
------------------------------------------------------------------------------
Post by Brian Merchant
_______________________________________________
Matplotlib-users mailing list
https://lists.sourceforge.net/lists/listinfo/matplotlib-users
------------------------------------------------------------------------------
Go from Idea to Many App Stores Faster with Intel(R) XDK
Give your users amazing mobile app experiences with Intel(R) XDK.
Use one codebase in this all-in-one HTML5 development environment.
Design, debug & build mobile apps & 2D/3D high-impact games for multiple
OSs.
http://pubads.g.doubleclick.net/gampad/clk?id=254741551&iu=/4140
_______________________________________________
Matplotlib-users mailing list
https://lists.sourceforge.net/lists/listinfo/matplotlib-users
Loading...