pythonpoison
2014-05-17 05:12:40 UTC
Hi,
I have placed a matplotlib on a wxpython panel, but the grey spaces around
chart area won't diminish, no matter what I try.
I tried using
self.fig.subplots_adjust(left=0.00001,right=0.0001,bottom=0.00001,top=0.0001)
and
self.fig.tight_layout(pad=0.00001)
but neither of them worked. Could you offer an opinion please? Thanks.
<Loading Image...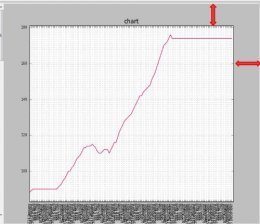 >
>
--
View this message in context: http://matplotlib.1069221.n5.nabble.com/How-would-you-make-a-matplotlib-chart-span-across-an-entire-wxpython-panel-tp43422.html
Sent from the matplotlib - users mailing list archive at Nabble.com.
I have placed a matplotlib on a wxpython panel, but the grey spaces around
chart area won't diminish, no matter what I try.
I tried using
self.fig.subplots_adjust(left=0.00001,right=0.0001,bottom=0.00001,top=0.0001)
and
self.fig.tight_layout(pad=0.00001)
but neither of them worked. Could you offer an opinion please? Thanks.
<Loading Image...
 >
>--
View this message in context: http://matplotlib.1069221.n5.nabble.com/How-would-you-make-a-matplotlib-chart-span-across-an-entire-wxpython-panel-tp43422.html
Sent from the matplotlib - users mailing list archive at Nabble.com.